What is BMI for children?
BMI for children is a quick screen of body composition: weight relative to height. Because children grow, the same BMI means different things at different ages, so the result is read against the norms for the child’s age and gender rather than a single adult cutoff.
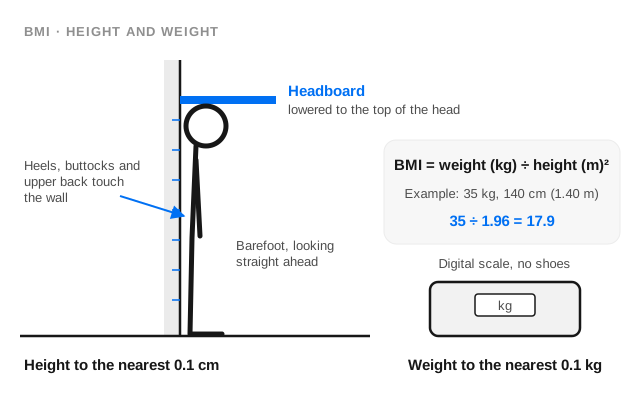
BMI for Children diagram
Who is measured
Age 5–18 — Class 1 to 12.
Equipment
- Stadiometer or a measuring tape fixed vertically to a flat wall
- Digital weighing scale (not a spring bathroom scale), checked against a known weight
- Record sheet or the Fitness Report Card template
BMI for Children procedure
- Height: the student stands barefoot with heels, buttocks and upper back touching the wall, looking straight ahead. Lower a flat headboard to the top of the head and record the height to the nearest 0.1 cm.
- Weight: the student stands still in the centre of the digital scale in light clothing, without shoes. Record the weight to the nearest 0.1 kg.
- BMI = weight (kg) ÷ height (m)². For example, 140 cm is 1.40 m.
- Round BMI to one decimal and look up the category for the student’s age (completed years) and gender.
BMI for Children scoring
- BMI is reported as a category — Underweight, Normal, Overweight or Obese — not as a level L1–L7.
- The table also shows the reference median BMI for each age. It is a guide, not a cutoff.
Enter the score in the fitness calculator to get the level and points for one student, or use class analysis for a whole class.
Teacher tips
- Measure at the same time of day for baseline and endline.
- Measure privately and talk about BMI sensitively — it is a health screen, not a grade.
BMI norms for children by age
BMI categories for boys and girls from the Fit India benchmarks.
BMI is rounded to one decimal before it is compared with the cut-offs. The median column is the reference median for that age — a guide, not a cut-off.
Boys
| Age | Underweight | Normal | Overweight | Obese | Median |
|---|---|---|---|---|---|
| 5 | ≤ 13.8 | > 13.8 to < 17 | 17 to < 18.4 | ≥ 18.4 | 15.4 |
| 6 | ≤ 13.8 | > 13.8 to < 17 | 17 to < 18.4 | ≥ 18.4 | 15.4 |
| 7 | ≤ 13.8 | > 13.8 to < 17.4 | 17.4 to < 19.2 | ≥ 19.2 | 15.4 |
| 8 | ≤ 13.8 | > 13.8 to < 18 | 18 to < 20 | ≥ 20 | 15.8 |
| 9 | ≤ 14 | > 14 to < 18.6 | 18.6 to < 21 | ≥ 21 | 16.2 |
| 10 | ≤ 14.2 | > 14.2 to < 19.4 | 19.4 to < 22 | ≥ 22 | 16.6 |
| 11 | ≤ 14.6 | > 14.6 to < 20.2 | 20.2 to < 23.2 | ≥ 23.2 | 17.2 |
| 12 | ≤ 15 | > 15 to < 21 | 21 to < 24.2 | ≥ 24.2 | 17.8 |
| 13 | ≤ 15.4 | > 15.4 to < 21.8 | 21.8 to < 25.2 | ≥ 25.2 | 18.4 |
| 14 | ≤ 16 | > 16 to < 22.6 | 22.6 to < 26 | ≥ 26 | 19.2 |
| 15 | ≤ 16.6 | > 16.6 to < 23.4 | 23.4 to < 26.8 | ≥ 26.8 | 19.8 |
| 16 | ≤ 17.2 | > 17.2 to < 24.2 | 24.2 to < 27.6 | ≥ 27.6 | 20.6 |
| 17 | ≤ 17.8 | > 17.8 to < 25 | 25 to < 28.2 | ≥ 28.2 | 21.2 |
| 18 | ≤ 18.4 | > 18.4 to < 25.6 | 25.6 to < 29 | ≥ 29 | 21.8 |
Girls
| Age | Underweight | Normal | Overweight | Obese | Median |
|---|---|---|---|---|---|
| 5 | ≤ 13.4 | > 13.4 to < 17 | 17 to < 18.8 | ≥ 18.8 | 15.2 |
| 6 | ≤ 13.4 | > 13.4 to < 17 | 17 to < 18.8 | ≥ 18.8 | 15.2 |
| 7 | ≤ 13.4 | > 13.4 to < 17.6 | 17.6 to < 19.6 | ≥ 19.6 | 15.4 |
| 8 | ≤ 13.6 | > 13.6 to < 18.2 | 18.2 to < 20.6 | ≥ 20.6 | 15.8 |
| 9 | ≤ 13.8 | > 13.8 to < 19 | 19 to < 21.6 | ≥ 21.6 | 16.2 |
| 10 | ≤ 14 | > 14 to < 19.8 | 19.8 to < 23 | ≥ 23 | 16.8 |
| 11 | ≤ 14.4 | > 14.4 to < 20.8 | 20.8 to < 24 | ≥ 24 | 17.4 |
| 12 | ≤ 14.8 | > 14.8 to < 21.8 | 21.8 to < 25 | ≥ 25 | 18 |
| 13 | ≤ 15.2 | > 15.2 to < 22.6 | 22.6 to < 26.2 | ≥ 26.2 | 18.6 |
| 14 | ≤ 15.8 | > 15.8 to < 23.4 | 23.4 to < 27.2 | ≥ 27.2 | 19.2 |
| 15 | ≤ 16.2 | > 16.2 to < 24 | 24 to < 28 | ≥ 28 | 19.8 |
| 16 | ≤ 16.8 | > 16.8 to < 24.6 | 24.6 to < 28.8 | ≥ 28.8 | 20.4 |
| 17 | ≤ 17.2 | > 17.2 to < 25.2 | 25.2 to < 29.6 | ≥ 29.6 | 21 |
| 18 | ≤ 17.6 | > 17.6 to < 25.6 | 25.6 to < 30.1 | ≥ 30.1 | 21.2 |
Source: Fitness Protocols and Guidelines for Age 5-18 Years (v1), Fit India Mission, Ministry of Youth Affairs and Sports, Section 7 Benchmarks, pages 48-57 (baseline reference for academic year 2020-21). Values verified against the PDF.
BMI for Children for Class 11 and 12 Physical Education
Students in Class 11 and 12 Physical Education often record this test in their practical file. A complete write-up ofBMI for children has the aim, the equipment, the procedure, a labelled diagram (you can redraw the one above), the scoring method and your own result with its level from the norms table.
For all the tests on one page, see the printable practical file summary on the SAI Khelo India Fitness Test page.
Frequently asked questions
Is BMI part of the total points?
No. BMI is shown as a category. Points come only from the fitness tests that use levels L1–L7.
Which age should I use?
Use completed years on the test date. The calculator can work it out from the date of birth.
How do I write up BMI for children in a Class 12 Physical Education practical file?
Write the aim (what BMI for children measures), the equipment, the procedure step by step, a labelled diagram, how it is scored, and your own result with the level from the norms table. The SAI Khelo India Fitness Test page has a printable summary of every test.